
Variant Perception: The Mechanics of Expectation Gaps
Insight Series: Applying the method to a live microcap idea with a growing earnings base and an operating valuation below 5x adjusted EBITDA

We have to be careful about what variant perception actually means if we want it to be useful.
Most of the time, it amounts to a simple disagreement with the market. An investor reads the same filings as everyone else, reaches a conclusion that fits with their prior beliefs, notices that the conclusion is not reflected in the share price, and treats the gap as an opportunity. Often, it is not.
Opinions are abundant in investing, and the market is full of people holding strong views on the same security while often talking past one another because they are using different assumptions, time frames, or notions of risk.
Michael Steinhardt meant something narrower when he described variant perception as “a well-founded view that was meaningfully different from market consensus.” He also emphasized the need to understand what the market’s expectations truly were. Those qualifications carry most of the substance.
The view has to be well founded, which requires more than confidence, novelty or a persuasive story. It must also differ meaningfully from the expectation reflected in the price. Establishing that difference requires some idea of what the market is already assuming. An investor cannot claim an informational or analytical advantage over an expectation he has never taken the trouble to identify.
That is where the actual work begins. Before you can hold a view that truly diverges from the market’s, you have to express the market’s view in language precise enough to disagree with. The price embeds a forecast, but that forecast is encrypted. The analytic act of variant perception is decryption first and disagreement second.
First, what future appears consistent with the current price?
Second, what do I expect instead?
Third, why should my expectation be more accurate?
Fourth, which observable developments would show that I am right or wrong?
That is variant perception in operating form. It is less a personality trait than a specific act of comparison.
A contrarian temperament may help someone tolerate an unpopular position. It cannot establish whether that position is analytically sound. A person can be independently minded, yet consistently mistaken. Markets provide no shortage of examples, and it is very likely most of us have contributed at least one.
Different Investors Can Disagree About Different Futures
It is easier to see what variant perception actually is by looking at something live. Let’s take Microsoft as an example, against a backdrop when artificial intelligence has become three things at once. A large commercial opportunity, a heavy claim on capital and a possible threat to the software franchises investors had long regarded as unusually durable.
Public disclosures give us only a partial view of any investor’s reasoning. With that limitation in mind, the positions taken by Chris Hohn, Bill Ackman and Michael Burry illustrate two forms that variant perception can take. Investors can disagree directly about the same core assumptions, or they can focus on different parts of the expectations compressed into the price.

Chris Hohn’s TCI, a fund built on concentrated bets in long-term compounders, had owned Microsoft for much of the preceding decade. By the end of March 2026, however, the fund had reduced Microsoft from approximately 10% of its portfolio to around 1%, disposing of most of a position that had been worth about $8 billion. Hohn explained that rapid advances in AI had made Microsoft’s future competitive position less certain. His main concern was Office, where new AI products could alter established workflows and create competing productivity platforms, although he also saw some risk to Azure.

Bill Ackman arrived at the other side of the equation. Pershing Square began buying Microsoft after the shares declined, arguing that the market was underestimating the durability of Microsoft 365 and Azure and overstating the risks surrounding its AI strategy. Ackman viewed Microsoft’s enterprise position, distribution and AI investment as sources of future growth, and considered the valuation after the decline highly attractive.
Hohn believes AI has made Microsoft’s moat less dependable than investors have historically assumed. Ackman believes Microsoft’s existing franchises place it in a stronger position to absorb and monetize the same technological change than the market currently recognizes.
Interestingly, their portfolios also diverged on Alphabet. TCI lifted Alphabet from around 3% to 5% of its portfolio as it cut back Microsoft, while Pershing sold roughly 95% of its Alphabet stake to help fund the new Microsoft position. The contrast is telling, but it isn’t a simple bullish vs bearish split on Alphabet. Ackman has said he remains very positive on Alphabet over the long term and treated it as a funding source for what he saw as a more attractive opportunity at current prices.
Both can agree that AI creates uncertainty. Their variant perceptions differ in the probability and economic weight they assign to the threat. Hohn sees enough risk to reduce a long held position substantially. Ackman sees a durable franchise whose declining price more than compensates for those concerns.

Burry’s position comes from a different angle. His long-dated call options seem to express the view that pessimism has gone too far over a particular period without requiring a definitive conclusion about Microsoft’s competitive position a decade from now. It is reasonable to infer that his disagreement concerns the distribution of outcomes embedded in the current price and the probability of a substantial recovery before the options expire.
The Microsoft example gives us both forms of variant perception at once. Hohn and Ackman are looking at the same central assumption and assigning different probabilities to it: Whether AI weakens Microsoft’s franchise or gives the company another way to extend it. Burry’s position appears centred more on price, probability and the time allowed for pessimism to reverse.
The facts available to all three investors are broadly the same, yet their conclusions differ because each places different weight on durability, risk, valuation and time. The same price can therefore contain several competing views of the future, even among experienced investors working from much of the same information. The discipline of variant perception is to identify the particular expectation you are challenging, explain why your alternative view is better founded, and specify what evidence would show that you were wrong.
To make that discipline concrete, this post is written in two halves. The first lays out the apparatus. How price encodes expectations, how those expectations can be read through a four-step method, and where the process commonly goes wrong. That portion is free, and the framework can be carried into any company you study.
The second half applies the same to a company in which I hold a small starter position and am actively monitoring. The current valuation suggests a potentially significant expectation gap, although the discount may still reflect risks the market is right to emphasize. The purpose is to show the method operating on a live idea, including how conviction should be staged and where the thesis can break.
Price as compressed expectations
A stock price carries the appearance of precision, yet it is better understood as a compressed argument about the future. It is the clearing point of a running auction in which investors press their expectations about growth, margins, risk, duration and required returns into a single figure.
Those views are weighted by capital and willingness to transact. The marginal buyer and marginal seller establish the price between them. Everyone else’s opinion remains dormant until it reaches the market as an order.
A price is therefore closer to a compressed sentence about the future. It says something about earnings, durability, reinvestment, risk and the return investors require, even though none of those assumptions appears explicitly on the screen.
Alfred Rappaport and Michael Mauboussin built the Expectations Investing framework around the task of making that sentence visible. The usual valuation process begins with a forecast of future cash flows, discounts those cash flows to the present, and compares the resulting estimate with the share price.
Their method begins from the opposite end. Start with the price, which is observable, and ask what pattern of future performance would make that price reasonable. The price becomes the starting question. Once you can state what the market is implicitly forecasting, you have something definite against which to test your judgment, instead of the comfortable exercise of building a model that cooperates with your hopes.
To make this concrete, lets look at a business I am currently monitoring and own in a small starter size.
A U.S. listed small‑cap industrial with defence adjacent exposure that is profitable, thinly traded, and well below the size band that attracts most institutional investors. Its contracted backlog has also grown in the most recent quarter which adds strength to the near term outlook. Yet the equity trades at less than 10x earnings. On first glance it looks cheap. We have to be mindful that this is only an impression. We need to analyze and ask what the discount is for.
The valuation is consistent with several possible expectations. The market may believe current profitability has limited duration. It may expect growth to remain weak, margins to retreat, or additional revenue to require more investment than the recent results suggest. Management believes limited awareness explains much of the discount. That explanation may contain some truth. It is also the explanation most management teams prefer when their shares are inexpensive, since it places the problem outside the business and inside the market’s failure to appreciate it.
Our task is to let the analysis decide.
A low multiple is best read as a question about the durability and quality of the earnings. The number tells us that investors demand a discount. It does not tell us which assumption is carrying that discount or whether the assumption is wrong.
A variant perception begins only after we can state the market’s implied view in words. Until then, we have an impression rather than a differentiated expectation.
Price‑implied expectations
The method has four stages. None of them requires fancy math. The hard part is sticking to the sequence and keeping the evidence separate from the conclusion one hopes to reach.
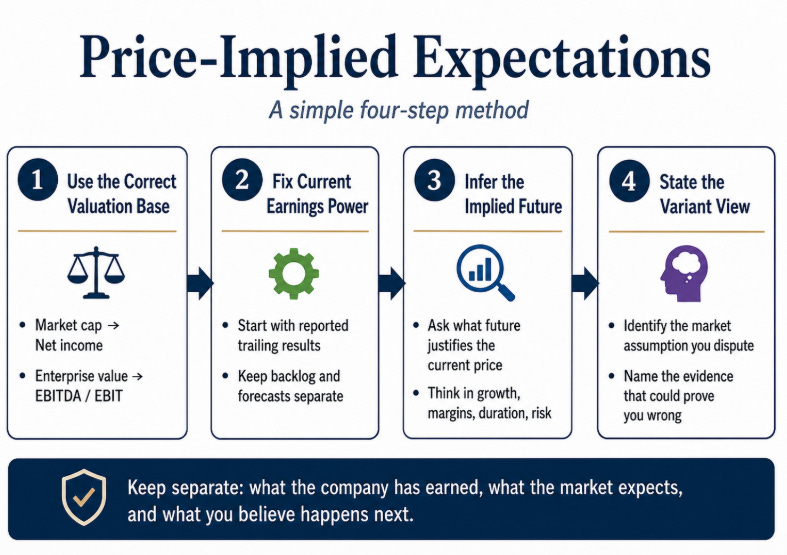
Step 1: Use the Correct Valuation Base
Market capitalization tells us what the equity costs. Enterprise value tells us what the operating business costs after accounting for net cash or net debt.
The distinction matters whenever the balance sheet is significant relative to the company’s size.
In our example, approximately one third of the company’s market capitalization is represented by net cash. An investor acquiring the entire company would therefore be paying roughly two-thirds of the equity value for the operating business and receiving the net cash alongside it.
Different earnings measures belong with different valuation bases. Net income belongs with equity value because it is calculated after interest and belongs to shareholders. EBITDA, EBIT and unlevered cash flow belong with enterprise value because they describe the business before the effect of financing.
The equity trades at less than 10x net income. After netting off cash, the operating business trades at under 5x adjusted EBITDA. Valuations are low but we have to be careful not to conflate that with mispricing.
The low multiple may compensate investors for weak returns on capital, concentration, poor liquidity, an uneven acquisition record or a short earnings duration. Removing cash from the market capitalization makes the operating business look cheaper. It does not remove the need to understand why the cash accumulated, whether it earns an adequate return, or how management intends to use it.
Step 2: Fix current earnings power
The second step is to establish an earnings anchor.
The anchor should reflect what the business has already demonstrated, using reported results that can be inspected and reconciled. It should remain fixed while we study the future.
It’s there so you start from reality and let your disagreements be expressed in the expectations. Not what it might earn next year or what it could earn if the backlog converts well. What it has actually earned, over the trailing twelve months, on the results already reported.
In this example, the company earned ~$3 million of net income over the latest twelve months. That is the starting point.
The growing backlog is a separate observation about what may happen next. It should remain outside the anchor until the revenue and earnings associated with it have been recognized.
The temptation is to let the two merge. You begin with the $3 million trailing earnings anchor. You notice that backlog is growing and allow expectations about future conversion to enter the starting figure, turning $3 million into $4 million or $5 million through assumptions that mostly serve the conclusion you already preferred.
The anchor exists to prevent exactly this. A claim that true earnings power exceeds the trailing figure can still be valid. It belongs in the variant view and should be supported by repeatable drivers. Those may include backlog that has historically converted at acceptable margins, a cost structure that can support additional revenue without equivalent expense growth, pricing actions already appearing in reported results, or a durable shift toward more profitable products.
Those claims should be stated separately.
Current earnings tell us where the business stands. The variant view explains why the future may depart from that starting point.
Step 3: Translate Valuation Into Implied Expectations
There’s a formal way to do this and an informal one, and both are useful.
Instead of forecasting cash flows and calculating value, we begin with the current value and solve for the operating assumptions required to justify it. Growth, margins, reinvestment, earnings duration and the required return can all be varied to see which combinations are consistent with the price.
For a small company, the output should be treated as a range. Modest changes in the discount rate, terminal value or forecast period can produce large changes in the answer, particularly where liquidity and company-specific risk make the required return difficult to estimate.
The purpose is to identify the broad future the price appears to require. Precision beyond what the inputs deserve tends to create an illusion of knowledge.
A simpler multiple-based approach can perform the same first-pass function.
At less than 10x trailing net income and ~5x adjusted EBITDA, the market appears to give limited credit to sustained compounding or improving business quality. The current valuation can be justified if earnings remain flat, if their duration proves short, if returns on incremental capital remain weak, or if the discount rate stays high because the company remains small and difficult to own.
Several permutations can produce the same price.
This is important because we often select the explanation most compatible with our preferred thesis. A shareholder may decide the discount reflects obscurity. A skeptic may decide it reflects poor business quality. Both explanations can sound plausible, and the price alone cannot choose between them.
PIE analysis narrows the inquiry. It asks which operating and financial assumptions appear most load bearing, and what evidence would distinguish one explanation from another.
Step 4: State the variant view in plain language
A precise variant perception compresses the analysis into one overarching disagreement with the future implied by the price.
It should explain why several observations belong together. A collection of encouraging facts remains a collection of facts until a causal argument connects them.
In the example we are studying, the market’s apparent frame is that recent strength belongs to a favorable period inside a small, fragmented and difficult to classify business. Under that interpretation, the order book is lumpy, the overseas growth may prove temporary, and current profitability deserves limited extrapolation.
The variant hypothesis is that the company’s existing embedded role may be deepening across more customer programs and overseas production networks. If that interpretation is right, order flow should become more repeatable, overseas activity should show a clearer connection to established customer relationships, and recent earnings should have greater duration than the valuation allows.
The backlog, geographic order growth and margin behaviour are therefore observable consequences of the underlying interpretation. They are not three separate variant perceptions.
A variant perception explains why those observations point toward a future that differs from the one embedded in the price.
When we take a deeper look at the business in the subsequent sections, we can examine whether its customer relationships, products and operating structure make the alternative interpretation well founded.
Where PIE Analysis Commonly Goes Wrong
One common mistake is treating a low multiple as proof of mispricing. A low valuation tells us that the market expects something unattractive, or requires substantial compensation for risk. The concern may involve growth, margins, reinvestment, duration, governance, liquidity or the reliability of the earnings. The number only tells you that further investigation is required and, by itself, does not supply an answer.
The second trap is allowing the forecast to leak into the starting point. Trailing earnings are quietly replaced by expected earnings before the investor has demonstrated how the business gets from one to the other. This makes the valuation look more attractive while concealing the assumption responsible for the improvement.
A third error is converting an operating indicator directly into profit. Backlog, customer additions, unit growth and order intake can all contain useful information about the future, but each remains several steps away from cash flow. Backlog has to convert into revenue. Revenue has to arrive at acceptable margins. Working capital, capital expenditure, taxes and other claims on cash must still be funded. Skipping those steps turns a leading indicator into an earnings estimate without showing the bridge between them.
Another mistake is solving for just one implied expectation when the price can be explained by several. A low valuation may reflect doubt about growth, concern about margins, a high required return, a short earnings duration or the need for substantial reinvestment. Investors often choose the explanation that best supports their preferred thesis. PIE analysis requires testing the combinations that could plausibly produce the same price.
Finally, there is the mistake of confusing knowledge of the company with knowledge of the expectation gap. You may understand the products, customers and competitive position in considerable detail and still have no edge if the price already reflects the same conclusions. The relevant question is always comparative.
What future appears consistent with the price?
What future do I expect?
Why should the two differ?
Which evidence would settle the disagreement?
These observations may support a variant perception, but they cannot constitute one on their own. Their value depends on the causal argument connecting them to a future path that differs from the one the market appears to price.
That is the apparatus for reading what a price implies. Yet identifying an expectation gap is only half the discipline. The harder questions begin after the expectation gap has been identified.
How much conviction does the alternative interpretation deserve?
Which developments would justify adding to the position?
What would weaken it?
What could allow the business to perform while the shares remain discounted?
How long can you wait before patience becomes an excuse for ignoring disconfirming evidence?
Those questions become clearer when the method is applied to a real business with real money at stake.
In the next section, we will reveal the company we have been discussing above, look at how it actually works, and walk through the remaining stages of the discipline.
Compressing the evidence into one overarching variant perception
Identifying the turbo triggers that will test it
Naming the conditions under which the chain from insight to return can break.
The rest of this deep dive is for paid subscribers.
The market does not lack information. It lacks attention directed at the right places. This publication searches for underfollowed companies, neglected bottlenecks and catalysts whose significance may not yet be reflected in the price.
Paid subscribers receive 3 to 4 deep dives each month, covering:
specific equity opportunities;
variant-perception frameworks through The Insight Series;
the complete research archive.
The aim is not to give you more market commentary. It is to help you see a small number of important things more clearly.
$10/month or $100/year.